Stop spending hours manually interpreting raw QEEG data. QEEGMaps transforms epoch files into stunning topographic maps, z-score analysis, and print-ready clinical reports β in under two minutes.
QEEGMaps is designed for speed and simplicity. Upload your data and see your patient's brain map within seconds β no waiting, no processing queues, no desktop software required.
Everything renders live in your browser. Click into any band to drill down into site-level z-scores, percentile rankings, and dysregulation analysis. Switch between Magnitude, Asymmetry, Coherence, and Dominant Frequency views instantly.
Generate professional, print-ready clinical reports with a single click. Every PDF includes anatomical brain textures, color-coded z-score maps, and detailed percentile tables β ready for patient charts, insurance documentation, or referral partners.
You decide what goes in the report. Customize which sections appear β topographic maps, z-scores, asymmetry, coherence, power ratios, protocol recommendations β so every report fits your clinical workflow.
Customizable Clinical PDF
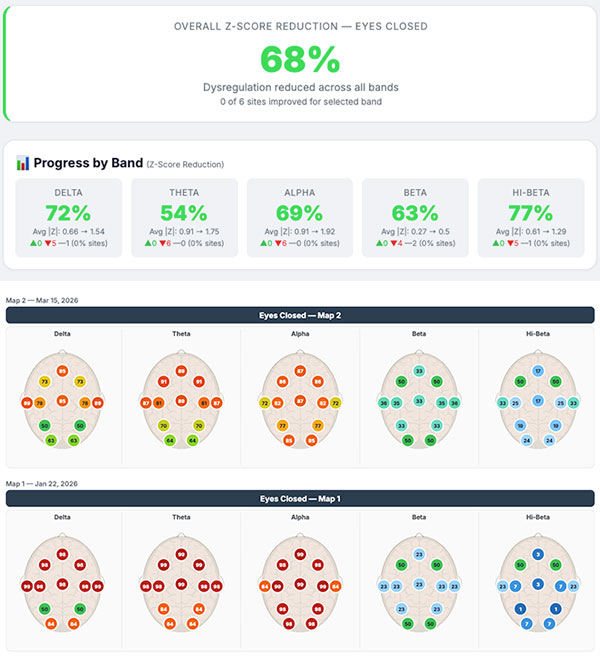
Show patients and referral sources exactly how neurofeedback training is changing brain activity. QEEGMaps generates side-by-side comparison reports that make treatment progress unmistakable.
Purpose-built for neurofeedback clinics. No bloated features, no learning curve.
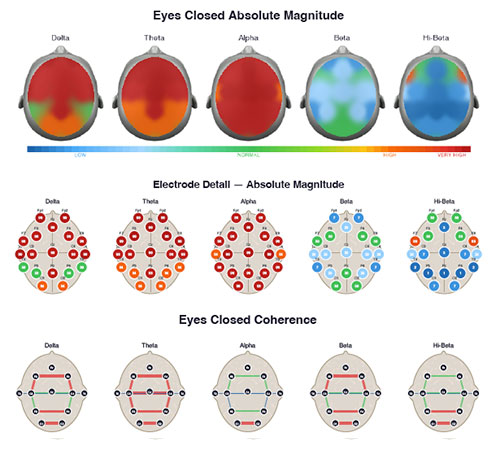
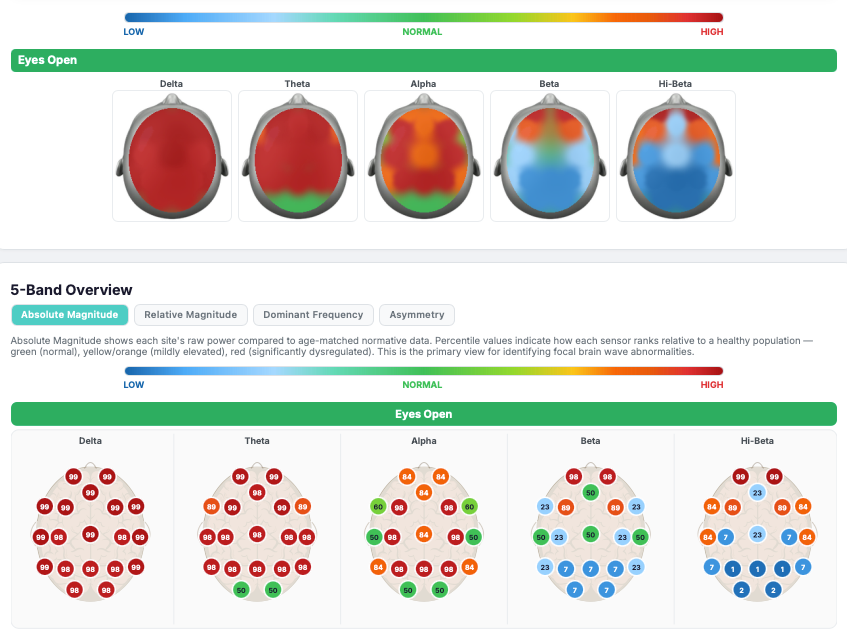
Color-coded brain maps using spatial interpolation across all 19 sensor sites. Instantly see hot and cold zones across five frequency bands.
Every sensor compared against age-matched normative data. Color-coded percentile circles make dysregulated sites impossible to miss.
Professional multi-page clinical reports with anatomical brain textures, all five metric types, and your clinic's branding. Under 500 KB.
Side-by-side baseline vs. follow-up reports. Show patients and referral sources exactly how training is normalizing brain activity.
Send patient intake forms directly via secure link. Automatically analyze results to recommend targeted metabolic supplements.
Automatic neurofeedback protocol suggestions and personalized Audio Visual Entrainment (AVE) sessions based on z-score patterns.
Identify the dominant frequency at each site. Spot excessive slow-wave activity or hypercoherence patterns that drive protocol decisions.
Interhemispheric asymmetry visualization for all five bands. Critical for identifying lateralized training targets.
Site-to-site coherence analysis to identify connectivity patterns and guide coherence-based training protocols.
From raw data to actionable clinical insight in under two minutes.
Paste or upload epoch data from any QEEG system β BrainMaster, NeuroGuide, WinEEG, or standard text exports. 19-channel montage auto-detected.
Z-scores calculated against age-matched norms. Topographic maps, asymmetry, coherence, dominant frequency, protocols, and dysregulations generated in seconds.
Download clinical PDFs, generate shareable patient links, and track progress over time with side-by-side comparison reports.
With one click, send your patient a secure link where they can view their brain maps, see their z-scores, and track their own progress between sessions β all from their phone, tablet, or computer.
Patients don't need to create an account or download anything. They simply tap the link you send them and instantly see their results in a clean, easy-to-understand visual format.
"View Your Brain Map Results"
Patients see their maps and progress β building understanding, buy-in, and referrals.
No hidden fees. No per-sensor charges. No annual contracts. Cancel anytime.
All plans include a free trial. No credit card required to get started. Your clinical data is yours forever.
Join neurofeedback clinics that trust QEEGMaps for fast, beautiful, and clinically accurate brain mapping.
No credit card required Β· Free trial included Β· Cancel anytime